8th International Conference on Engineering Computer Graphics and Descriptive Geometry
July 31 - August 3, 1998 - Austin, TX - USA
An On-line Interactive Tutorial on Projective Geometry
Eduardo T. SANTOS, CHENG L. Yee
and João R. D. PETRECHE
University of São Paulo
São Paulo, BRAZIL
ABSTRACT
The Projection Theory is the theoretical foundation for topics including orthographic, axonometric, oblique and perspective views, topographic maps and Descriptive Geometry. It usually presents difficulties to the students mainly because of the tridimensional visualization skills needed. Since this Theory is a classical discipline, there is a lack of specific didactic materials that employ modern technologies. In order to overcome the difficulties faced by the students, we developed an interactive tutorial, accessible from the Internet, whose objective is teaching aspects of the Projective Geometry.
For understanding this subject, it is crucial to the students to visualize the problems as a 3D scene. To help them on this task, most figures on this tutorial are implemented as Java applets. Applets are also used for showing how to solve proposed problems. In order to avoid using sequences of figures, we implemented an applet that presents the graphical solution step-by-step and also provides a textual and/or audible explanation to the students.
The developed material also includes applications and a "history" of the theory for increasing learning motivation.
We believe this on-line tutorial presents several advantages over the traditional teaching methods: it considers each studentís individual learning speed, offers a more attractive and intuitive means of learning, allows self-evaluation and increases the availability of information to the student.
- . INTRODUCTION
The Engineering Drawing course is offered in the Polytechnic School, University of São Paulo to more than 750 Engineering and 140 Architecture freshmen students every year.
In this course, the Projection Theory is considered one of the most important topics. It forms the base of the whole theoretical development related to the visualization of three-dimensional objects and its graphic representation in bidimensional entities such as paper, computer screen, etc. Moreover, it is the theoretical foundation for many other topics including orthographic, axonometric, oblique and perspective views of three-dimensional objects, topographic maps, Descriptive Geometry, etc.
In order to develop the studentís ability to solve the spatial geometry problems, a series of exercises on the Projection Theory is proposed. The exercises involve the determination of the projections of points and lines, vanishing points, intersections of lines or planes, etc.
Most of the students have difficulties to apply the concepts of the theory to solve exercises. Among the aspects that harm the learning, the spatial visualization skills required seems to be the main reason. On the other hand, since the theory is a classical topic, there is a lack of specific didactic materials that employ modern technologies on this subject.
With the purpose of helping the students to overcome these learning difficulties, we developed an interactive tutorial accessible from the Internet, for teaching topics of the Projective Geometry. The tutorial is organized as a series of web pages implemented with up-to-date technologies. It features:
- Hypertext: used to present the information in a hierarchical way, allowing the users to control the detailing of the topics according to their interests;
- Java applets: for providing interactivity to the material;
- Computer animation, digitized videos and sounds: for illustrating the concepts and practical examples, bringing reality to this often abstract theory;
- Stereoscopy and motion parallax: to help the students to visualize the spatial situations presented in the theory and exercises.
The next section is about some of the hypertexts elaborated to raise the student learning motivation. After that, the implemented Java applets are described in detail.
- . MOTIVATION
As a means of learning motivation, the tutorial presents solutions for some practical geometric problems such as the shadow determination using the theory. Step-by-step explanations are provided for both sunlight (parallel projection), and spotlight illuminations (central projection). Other interesting applications of the theory are also presented (fig. 1).
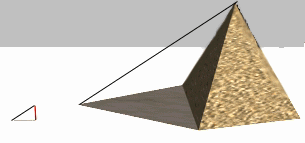
Figure 1 - An application of the theory - technique used by the Ancient Egyptians to determine the height of pyramids.
In addition, a module shows the evolvement of the theory. It starts from the primitive arts stage, where the people were discovering the shapes. It goes through the ancient civilizations (Egyptian, Mesopotamian, Greek, Roman, Chinese, etc.) notions concerning space and the methods each one used to created the illusion of the depth on a bidimensional frame. The works of some geniuses of Renaissance such as Giotto, Da Vinci, etc. are illustrated by showing the exactness of the perspective techniques they employed. Finally, back to the contemporary age, the studies of the quantitative aspects of the theory are incorporated in the computer graphics through the methods of the Analytic Geometry.
The topics are organized as a hypertext and computer graphics and other multimedia resources are adopted for making the learning process easier and more exciting.
- . THE APPLETS
Applets are small applications written in the Java language (Arnold and Gosling, 1998) that can be embedded in html pages and executed unmodified in any Java-enabled browser, regardless of operating system or processor type. Applets allow interactive content to be added to web pages.
Three Java applets were developed for this tutorial. Their functionality will be described in the following subsections.
- Interactive Figure Applet
The "interactive figure" applet aims to help student's spatial vision. Different from a common illustration on a printed book or a static image on a web page, this applet allows the student to rotate the scene depicted on the image by clicking and dragging it. The motion parallax produced by rotating the scene provides a good physiological depth cue enough for helping the student to visualize the spatial relationship between the scene elements. A "reset" button is provided so that the original position of the scene can be restored anytime (figure 2).
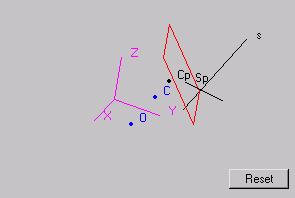
Figure 2 - The Interactive Figure Applet
The scene, usually composed of points, lines (or polygons) and planes, is represented in a script file read by the applet. This script is a text file that can be easily prepared by the instructor using a special description language which has the commands shown on table 1.
|
Command |
Parameters |
|
CAMERA |
x y z |
|
LINE |
label x1 y1 z1 x2 y2 z2 [color]
label plane1 plane2 [color] |
|
POINT |
label x y z [color]
label line1 line2 [color]
label line plane [color] |
|
PLANE |
label x1 y1 z1 x2 y2 z2 x3 y3 z3 [color] |
|
PPOINT |
label point obs plane [color] |
|
PLINE |
label line obs plane [color] |
Table 1 - Scripting language commands
The CAMERA statement is used to set up the initial viewing position. The camera target is always at the coordinate system origin.
All elements can be assigned an optional color (specified by name - red, blue, etc.) and a label (Greek letters are specified as "alpha", "gamma", etc.) which is displayed next to it.
Points can be specified by 3D coordinates or by referring to the labels of two intersecting lines or of a line and a plane. Lines are specified by one pair of 3D coordinates or by the intersection of two planes. Planes must be indicated by the 3D coordinates of 3 points, which are used by the applet to draw a rectangle representing it.
Also, projected points (PPOINT) and lines (PLINE) can be indicated by specifying the element to be projected, the observer position (center of projection) and the projection plane.
If necessary, the instructor can make use of any 3D CAD system for getting the coordinates of points in space, after constructing the scene in 3D.
For making the spatial visualization of the scene even easier, two stereo techniques were incorporated on this applet: stereo pair and anaglyphs.
In the "stereo pair" mode, two images of the scene are shown side-by-side in the applet area (figure 3). The images differ only regarding the observer position, providing adequate binocular disparity (stereopsis). The user must use "free-viewing" techniques (parallel or transverse) for getting a 3D perception (Harrison et al., 1997).
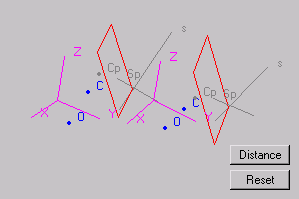
Figure 3 - The Interactive Figure Applet - stereo pair mode
Due to variations on monitor size and resolution, a set-up mode is provided so that the user can adjust the distance between the pair of images that will result in the most comfortable viewing. This is made by controlling the distance between two dots (which appear as four when viewed without eye convergence). The user must make two of them to converge to the same spot so that only three dots are seen (fig. 4).
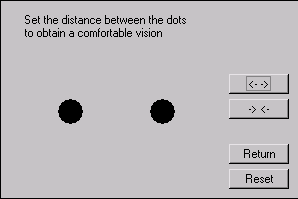
Figure 4 - The stereo pair distance setting mode
Some people have difficulties for using stereo pairs, as effective viewing requires some training. Because of that, an anaglyph mode was also implemented in this applet.
Anaglyphs were, in the past, often used in Descriptive Geometry books. We are now again making the same use, but with the help of high technology.
The anaglyph represents the same images used in the stereo pair but without the spatial displacement. Besides, one of the images is draw in red and the other in a green color. The user must wear an anaglyphoscope, which are spectacles with a red lens for the left eye and a green one for the other. The lens act as a filter, making the red image invisible for the left eye as the green is for the right eye. Each eye can see only one of the images and it appears in black color, producing a stereo effect (figure 5).

Figure 5 - The Interactive Figure Applet - anaglyph mode
This kind of stereo viewing is easier to use for most people. Its disadvantages are the need for a anaglyphoscope and the lack of colors. Another problem is related to "ghosting" (interocular crosstalk). If the colors are not very well matched with the lens colors one eye will see the other eye view as well. Although ghosting does not impair the overall 3D perception of the scene (Nyciper and Heppes, 1994), it can be distracting and cause eye fatigue (Harrison et al, 1997).
Because differences in lens colors (some manufacturers even use blue instead of green) and variations in color and intensities of computer monitors all contribute to ghosting, a setting mode was also implemented in the applet when used in anaglyph mode. The user can control the hue and brightness of both the red and green images using scrollbars until (almost) complete cancellation is achieved (fig. 6).
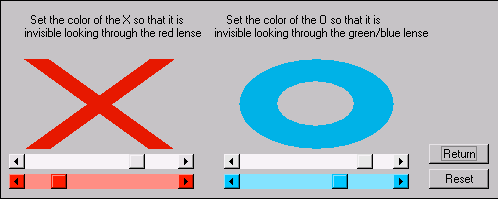
Figure 6 - The anaglyph color calibration mode
The file containing the script is specified as a parameter to the applet in the web page. The same applet can be used several times in the tutorial with different script files.
Solver Applet
Even when the solution of a projective geometry exercise is shown to a student, it is hard for him/her to understand it because the sequence of the operations performed was lost. Also, there are usually so many lines in the drawing that visualization is complicated.
In textbooks this problem is solved representing the solution step-by-step using many figures. In an Internet-based tutorial, the use of a sequence of images can be prohibitive because of bandwidth restrictions (long download times). We opted for implementing a "solver" applet, which presents an animation of the solution to the student (figure 7) and has some other advantages.
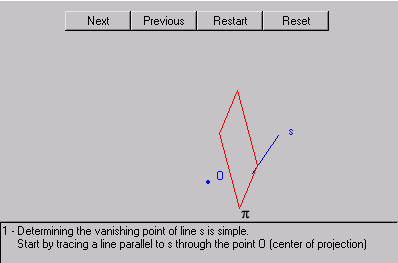
Figure 7 - The Solver Applet
The solution process is divided in steps. The student controls the animation steps with buttons labeled "next", "previous" and "restart" whose meaning is obvious.
As the next step is commanded, a text area below the image shows a written explanation for that phase. The elements are "slowly" drawn on the applet canvas so that the student can follow their creation. Optionally, an audio file, containing a recorded narration of the text, can be simultaneously played, making the interface more human and friendly.
This applet is driven by the same kind of script file as the "interactive figure" applet. The script language is the same but have three additional commands, listed in table 2.
|
Command |
Parameters |
|
FRAME |
|
|
TEXT |
text stringÖ |
|
AUDIO |
filename.au |
Table 2 - Additional scripting language commands
The FRAME keyword separates blocks of elements which are to be drawn in each step. The parameter of the TEXT command indicates the text to be shown in the respective solution step. Finally, the AUDIO command specifies the audio file (.au format) to be played in that step. If these commands are present in a script for the previous applet, they are simply ignored, thus maintaining compatibility.
As the scene is described in 3D, the same "click and drag" motion capability of the interactive figure applet is present in the solver applet, although it can be disabled by the instructor if desired.
Exercise Applet
For student evaluation purposes, an "Exercise" applet was devised and implemented (figure 8). This time, because we want to simulate the same conditions of traditional projective geometry evaluation ("paper and pencil"), no special (motion or stereo) visualization help is provided.
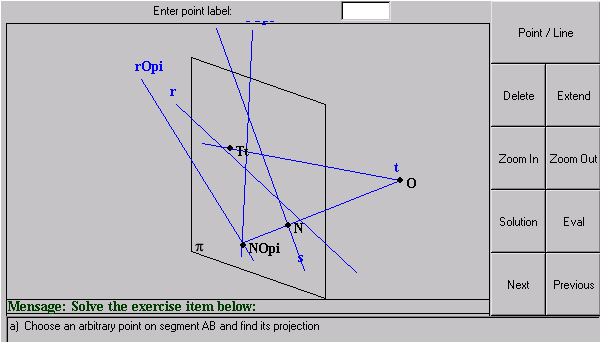
Figure 8 - The Exercise Applet
This applet presents a series of question items to the student and allows her/him to solve them using simple graphical tools. The following operations are possible:
- point marking (intersection of lines or on a line);
- line drawing between two existing points;
- drawing a line parallel to other line, on a given point;
- extending a line;
- erasing an element (point or line);
- marking one or a group of elements as a solution;
- zooming in and zooming out;
A message area guides the student on using the graphical tools. The student uses the buttons labeled "previous" and "next" for seeing the question items and deciding the one he/she wants to solve in that moment.
After marking elements as a solution for the current question item, the student presses the "evaluate" button. The applet reads the coordinates of the correct solution from the script file and compares them with the location marked by the student. A small variation on the solution exact coordinates is also considered to be correct to account for possible rounding-off errors.
If the solution is correct, the student is greeted by a written message and optionally by an audible one. If the marked solution is wrong, the applet prompts the user for revising the section of the tutorial where the subject is covered. If confirmed, the applet automatically loads that page on the browser window.
This applet uses an script file with the same commands of the other two, although being incompatible because it takes only 2D coordinates. Also, another keyword is introduced (SOLUTION) for marking a block of elements as the solution of a question item and specifying the URL of the tutorial page containing the topics to be reviewed in case of error. These elements are never drawn in the canvas by the applet. They are used only for checking the student solution.
The web server where the tutorial is available is programmed to send a randomly chosen exercise from a specified collection each time an exercise applet is started and requests an script file. Two students, following the same tutorial at the same time on different computers would get different exercises to solve.
The script files can be encrypted if desired for guarantying that the students will not sneak inside it for the correct solution of a proposed exercise.
- . CONCLUSIONS
This paper presented an interactive tutorial on Projective Geometry using advanced technology readily available on the Internet.
Hypermedia objects (images, animation, hypertext and sound), together with a historical evolution of the subjects presented and a showcase of its practical applications were used for developing this tutorial. This decision aimed to achieve the most motivating teaching tool possible for surpassing the problems faced by students with difficulties in spatial visualization.
The proposed applets exhibit a very simple and friendly interface, not requiring any training for their use. The script files that drive the applets have an intuitive and simple format, making the creation of on-line solved or proposed exercises very easy.
By the time this paper is published, this tutorial will be available on the Internet for international free use. We will make the first evaluation of its efficiency as a distance-learning and on-class teaching tool in the following semester.
As further works, we intend to study the use of more advanced stereo solutions (LCD shutter glasses) and to extend the tutorial to related topics like Descriptive Geometry, Topography and Orthogonal Views.
ACKNOWLEDGMENTS
The authors would like to thank the Pró-Reitorias de Graduação e Pós-Graduação of the University of São Paulo for funding this project and André L. T. da Silva and Gabriel E. Villa for their collaboration on the implementation of this tutorial.
REFERENCES
Arnold, K., Gosling, J., 1998, The Java Programming Language, 2nd Edition, Addison-Wesley Publishing Co., Reading, Mass., USA.
Harrison, L. , McAllister, D., Dulberg, M., 1997, Stereo Computer Graphics for Virtual Reality, SIGGRAPH Course Notes #6, ACM.
Nicyper, R., Heppes, A., 1994, Constructing Anaglyph Images on Phantogram Perspective Charts, Jerry Haines Sales, West Corvina, Calif., USA.
ABOUT THE AUTHORS
Eduardo T. Santos, Ph.D., is an Assistant Professor in the Department of Civil Construction Engineering, Polytechnic School, University of São Paulo. His research interests are in Computer Graphics, Applications of Virtual Reality to Construction and Technologies for Education. He can be reached by e-mail: toledo@pcc.usp.br, by fax: +55-11-818-5715, or through postal address: Edifício de Eng. Civil / Cidade Universitária / 05508-900 São Paulo - SP / Brazil.
Cheng L. Yee, Ph.D., is an Assistant Professor in the Department of Civil Construction Engineering, Polytechnic School, University of São Paulo. His research interests are in Computer Simulations, Application of the Fuzzy Theory to Engineering Design and Teaching Methodology. He can be reached by e-mail: cheng@pcc.usp.br, by fax: +55-11-818-5715, or through postal address: Edifício de Eng. Civil / Cidade Universitária / 05508-900 São Paulo - SP / Brazil.
João R. D. Petreche, Ph.D., is an Assistant Professor in the Department of Civil Construction Engineering, Polytechnic School, University of São Paulo. His research interests are in Engineering Optimization and Stochastic Structural Dynamics. He can be reached by e-mail: petreche@pcc.usp.br, by fax: +55-11-818-5715, or through postal address: Edifício de Eng. Civil / Cidade Universitária / 05508-900 São Paulo - SP / Brazil.


